Ask a model how sure it is
Three local models answered 1,000 MMLU questions each and rated their own confidence from 0 to 100. In 3,000 answers, a number under 80 came up eight times.
Most judge pipelines I have seen ask the model one follow-up question: how sure are you? The number goes into a threshold. Below 80, send it to a person. Above 90, accept it without looking. The August post on judges listed calibration among the things to measure and left it as a hypothetical, a judge that says 90% while being right 70% of the time. This is the measurement.
I took the three local models from that post and gave each of them 1,000 questions from MMLU, asking for two things in a JSON object: the letter, and a confidence from 0 to 100 that the letter was right. Temperature 0, one answer per question, no reasoning step. The 1,000 questions are a fixed sample of the 14,042 in the test split, drawn in proportion to its 57 subjects, and the whole run took 37 minutes on a laptop.
What the numbers meant
| Model | Right | Mean stated | Said 90 or more | Right when it did | Calibration error |
|---|---|---|---|---|---|
| llama3.1:8b | 65.9% | 88.5 | 56% of answers | 73.8% | 0.23 [0.20, 0.26] |
| qwen2.5:14b | 77.8% | 94.4 | 94% of answers | 79.4% | 0.17 [0.14, 0.19] |
| aya-expanse:8b | 61.7% | 97.8 | 98% of answers | 61.9% | 0.36 [0.33, 0.39] |
The gap between what a model said and what it did runs from 17 points to 36. aya-expanse put 100 on 593 of its 1,000 answers and was wrong on 236 of them. qwen, the most accurate of the three, put 95 on 878 answers, and those were right 79% of the time. A stated 95 meant 79, and it meant it 878 times.
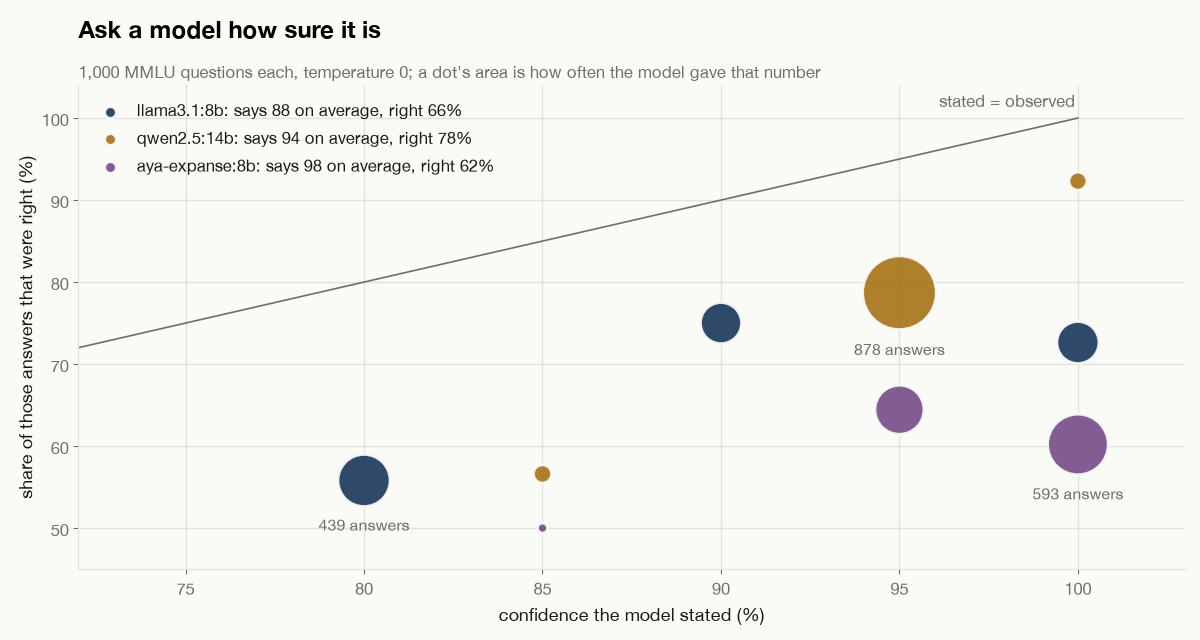
None of the three used the scale it was given. Across 3,000 answers a number under 80 appeared eight times, and llama never went below 80 at all. Asked for a percentage, llama chose from four values in a thousand answers, aya from five, qwen from nine, and qwen spent 878 of its thousand on one of them. The prompt said 0 to 100. The models heard 80 to 100.
A ranking, sometimes
The level was wrong for all three. Whether the number ranked anything is a separate question, and there the three come apart. llama’s 80s were right 56% of the time and its 90s and 100s about 74%, so its number sorts answers into two piles even though it names neither pile correctly. qwen’s did better: 85 meant 57%, 95 meant 79%, 100 meant 92%. Each step up bought something, and the overshoot shrank as the number rose: 28 points at 85, 16 at 95, 8 at 100. aya’s number carried nothing. Its 100s were right 60% of the time and its 95s 64%, so the extra five points of stated confidence pointed the wrong way.
There is a blunt way to check whether a stated confidence is worth anything at all: compare it with a constant. Replace every number a model gave with its own overall hit rate, 66% for llama, and score both with the Brier score. The constant wins for all three models. A reader who ignores the confidence and writes down that this model is right about two thirds of the time holds a better forecast than the model’s own.
What is behind the numbers
Several things push on these figures, mostly in one direction. MMLU is old and widely trained on, so the accuracies here are probably higher than they would be on fresh questions, and that makes the gap look smaller than it is. The JSON schema forced a number onto every answer, which is how confidence gets collected in a pipeline, and it may not be how a model would volunteer one. Temperature 0 gives one answer per question, so this says nothing about how the number moves between runs. The models are small and local, chosen because they were on my machine. A frontier model will land somewhere else on the chart, and the only way to know where is to run it.
One correction runs in the other direction. qwen said 100 on 52 answers and the answer key marked four of them wrong. One of the four asked for 365 + 56, offered 300, 309, 311 and 421, and the key says 309. The model said 421. A 2024 re-check of MMLU, Are We Done with MMLU?, found errors in roughly 6.5% of the questions it examined. That is enough to move an accuracy figure a little and not enough to reorder anything here. A gap of 17 to 36 points does not come from the answer key.
What to do with the number
The audit takes one command once the answers sit in a file with the stated confidence and the outcome. My three files are on the site, so you can run it on them first:
pip install calikit
curl -O https://mohammadi.cv/assets/data/blog/calibration/llama3.1-8b.jsonl
calikit audit llama3.1-8b.jsonl --rescale 0,100
It prints the Brier score next to the score a constant base rate would get, the calibration error with a bootstrap interval, a significance test, and a reliability diagram if you ask for one. The three files behind this post are committed with the site and it reads them as they are.
If the number ranks answers, as llama’s and qwen’s do, a recalibration map recovers a usable probability from it. Fit on half the questions, score on the other half:
calikit fit odd.jsonl --method platt --eval even.jsonl --rescale 0,100On the held-out half the Brier score improves for all three, from 0.25 to 0.22 for llama, 0.19 to 0.17 for qwen and 0.38 to 0.24 for aya, and the calibration error drops from 0.21 to 0.09, 0.16 to 0.08 and 0.37 to 0.07. The fitted map says the same thing as the table. It sends llama’s 80 to 61%, its 90 to 62% and its 100 to 70%, and it sends qwen’s 95 to 76% and its 100 to 94%. For aya the slope came out slightly negative: the map ignores the number and returns the base rate, and its Brier score lands where the constant’s does. There was nothing in the number to use.
The map fixes the level and leaves the shape. llama’s 90s were right more often than its 100s, and a map that keeps the order of the stated numbers cannot undo that, so its error stops at 0.09.
A threshold on a stated confidence is a threshold on a number the model was never trained to mean. Audit it once on a few hundred labelled items, fit the map, and threshold on what comes out. Or skip the number and use the base rate. On this evidence that is the better forecast anyway.